Have you ever wondered how your income stacks up against others in your age group?
I know I have 🙂
Using data from the 2022 IPUMS Current Population Survey, we can visualize how pre-tax wage income percentiles vary for every age in the United States.
More specifically, we’ll be taking a look at:
- What is the Average & Median American Income by Age?
- Income Percentiles by Age
- Income Percentiles by Age Over Time
With that being said, let’s dive in!
What is the Average and Median American Income by Age?
In 2022, the average and median pre-tax wages for all Americans between 18-85 are as follows:
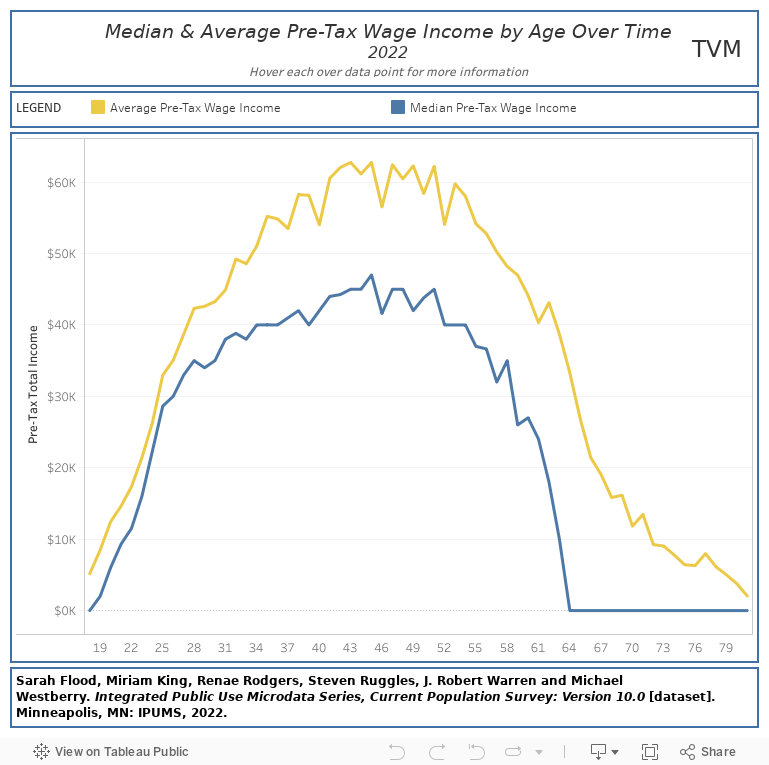
What I found particularly interesting was the earnings growth rate between the average 18 year old and average 30 year old. In that 12 year period, average earnings grew by 760% or 63% a year on average.
While the majority of Americans’ income will continue to grow until they hit their peak earnings years in their mid-40’s, it is nowhere near the amount of growth they will experience when going from 18 to 30 years old.
This makes sense if you think about it. In that 12 year period, people are graduating college, going into a lucrative trade or developing specialized skillsets which increases their overall earnings potential.
On the other side of the spectrum, our 50’s is often when we begin to start seeing declines in our pre-tax wages. Around the mid 60’s is when wages begin to bottom out due to older individuals retiring from the workforce and transitioning to Social Security.
Visualizing Income Percentile by Age
Using the interactive filter below, we can better understand how our current earnings compare to those in our age group. We can also use the below visualization to identify how much we would have to earn in order to be in the top X% of wage earners for our age.
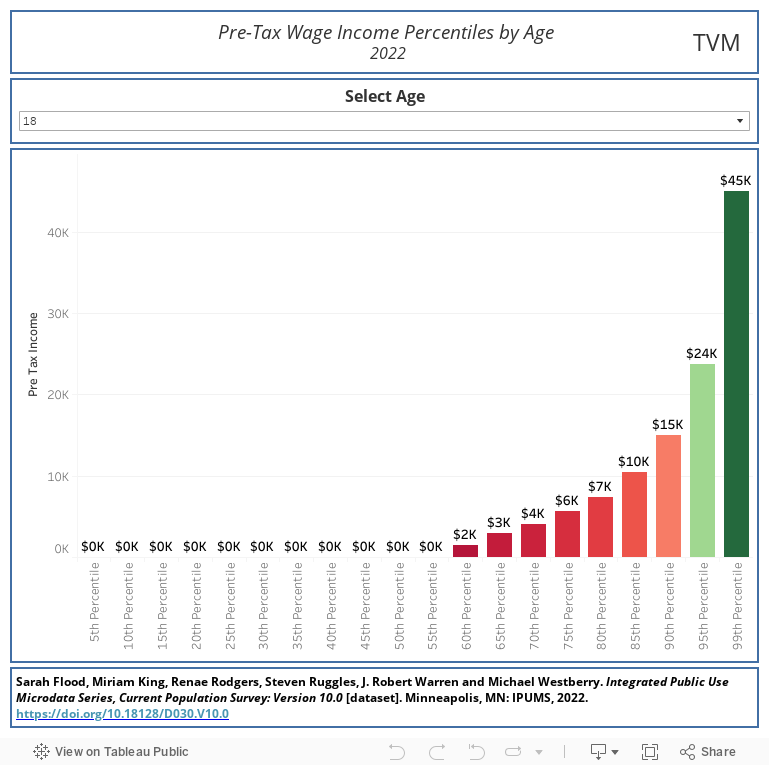
As an example, an 18 year old would need to earn a minimum of $45,000 / year in order to be in the Top 1% whereas a 28 year old would need to earn a minimum of $181,000 / year.
I like this visualization in particular because it helps keep things in perspective.
Imagine that you happen to fall in the Top 10% of wage earners for your age group.
Sure, you can work harder in order to crack the Top 5% or even Top 1%. However, because of the law of diminishing returns, the juice would not be worth the squeeze. In other words, why continue to work super hard for the chance to go up a measly 5 percentile points? At that point, it’s not worth it.
From a financial independence and statistics perspective, we are already earning “a lot of money” when compared to others in our age group. At that point, it makes a lot more sense to focus on the other side of the financial independence equation by decreasing our expenses in order to increase our savings rate.
On the other hand, imagine that instead our income fell in the 35th – 40th wage percentiles for our age group. At that point, it makes a lot more sense to spend the calories in order to increase our income because of the income growth potential. In this case, increasing our income would be more effective than decreasing our expenses because there is only so much that we can cut out of our budget.
Income Percentiles by Age Over Time
As our age changes so does the income percentiles. Below is an interactive visualization showing the change in pre-tax wage income percentiles as we get older.
Note: All income percentiles are listed out by default. However, you can filter the data to see the specific income percentiles that you care about.
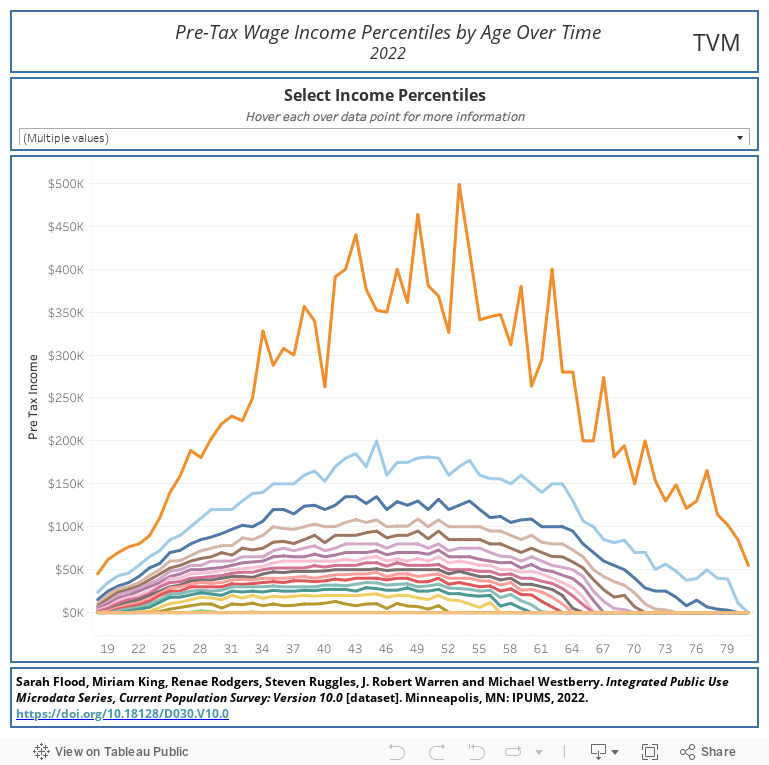
The trend that really stood out to me was that there appears to be a correlation between higher income percentiles and income growth potential as we age.
To illustrate what I mean, let’s compare pre-tax wages of the Top 50%, Top 75% & Top 1%:
| Earnings at Age 19 | Earnings at Age 47 | Total Income Growth | |
| Top 50% | $2K | $47K | $45,000 |
| Top 75% | $12K | $80K | $68,000 |
| Top 1% | $62K | $352K | $290,000 |
In other words, the Top 75% of wage earners have 51% more income growth potential than the Top 50% of wage earners. Likewise, the Top 1% of wage earners have 326% more income growth potential than the Top 75% of wage earners.
Final Thoughts
It is critically important to keep things in perspective.
That is because it is easy to get mindlessly caught up in the “more money” mindset when in reality we may already be at the top of the income band for our age.
Because at the end the day, more income is meaningless if it doesn’t translate to a higher savings rate. The person making $352K / year and spending $352K / year is worse off than the individual making $60K / year and only spending $40K / year.
Thank you for reading 🙂
_
Full Disclosure: Nothing on this site should ever be considered advice, research or an invitation to buy or sell securities, please see my ‘Terms & Conditions’ page for a full disclaimer.
Great one! Loved the visuals
Thank you! Hopefully it was helpful 🙂