
When it comes to financial independence, not all expenses are created equally.
The big 3 expenses of housing, transportation and food together make up 63.5% of the average American household’s spending.
In this post, I will be visualizing how reducing our spending in these categories has the greatest impact on our path to financial independence.
Note: Some of the data visualizations are interactive; hover over sections of the graphs for more detailed information.
What does the average American Household spend their money on?
The U.S. Bureau of Labor Statistics conducts a massive survey every year in order to answer this question. If you are curious on how American’s spending habits have changed over time, I did an analysis that you can check out here.
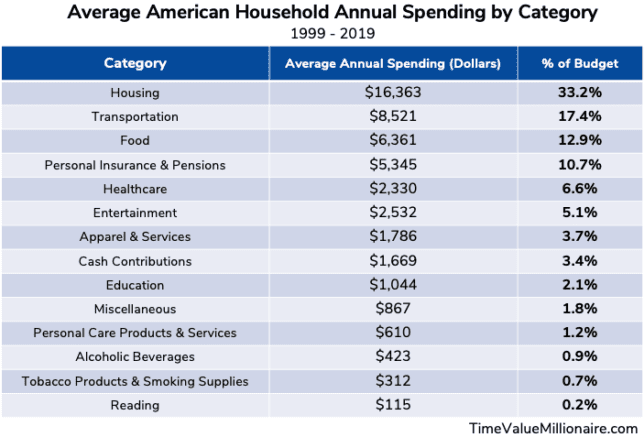
However, looking at data from 1999 – 2019, the average spending breakdown for American households can be represented by the below visualization:
For every $1.00 that we spend, $0.64 goes towards housing, transportation and food.
The other $0.36 is then split among 11 remaining budget categories. That is insane.
Furthermore, total spending on entertainment, clothing and alcohol only make up roughly $0.10 on average for every dollar that Americans spend.
Despite being a low percentage of our budgets, mainstream personal finances articles will swear that reducing this type of spending is necessary to achieve financial independence.
This inadvertently advocates a “penny wise and pound foolish” mentality.
Reducing our ‘fun budget’ makes a good headline, but in practice can then lead to the all-too-common feeling of deprivation.
And if you are depriving yourself, you are doing something wrong.
Visualizing the Impact on Financial Independence
Establishing a Baseline
Using the methodology I wrote about in my post on calculating progress to financial independence, our first step is to calculate an annual budget.
Based on the table below, we get an average annual budget of $48,278.
Using a 4% withdrawal rate, we can calculate a Baseline FI number for the average American household:

This gives us a FI Baseline of $1,206,950.
The Big 3 Expenses vs. 3 Discretionary Expenses
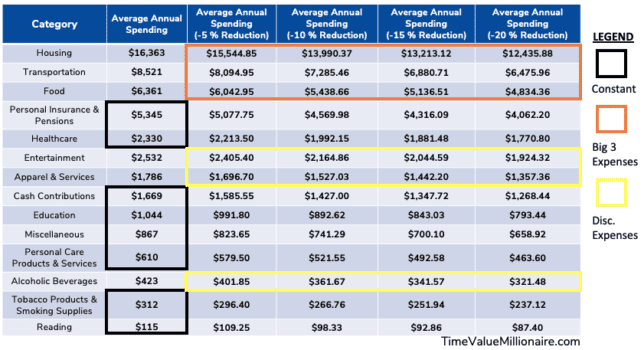
With a FI Baseline established, we can now evaluate how gradual reductions in the following two sets of budget expenses will affect the baseline:
- The Big 3 Expenses = Housing, Transportation & Food Budget Categories
- 3 Discretionary Expenses = Entertainment, Clothing & Alcohol
The remaining budget categories will remain constant with no reductions.
The result is the below table showing what a 5%, 10%, 15% and 20% reduction in each the selected budget categories would look like:
There is a clear winner…
With our newly reduced annual budgets, we can leverage the FI formula from earlier to calculate two new FI Numbers (based on on the two categories that were reduced).
The results are as follows:
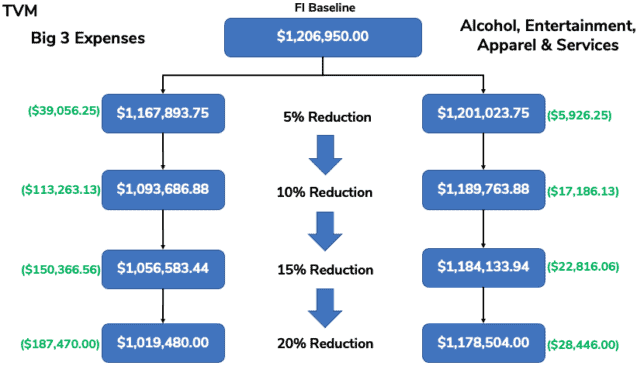
There is a clear winner.
Reducing the big 3 expenses had a 6.6X greater impact on the FI Baseline versus identical percentage reductions in the 3 discretionary expenses.
And that’s only reducing our expenses…
What would happen if we reinvested those savings?
We saw what would happen to the FI Baseline given the reduction in certain budget categories.
However, let’s go one step further and see what reinvesting those savings would look like over time.
First, let’s make some assumptions:
- Time period of 50 years
- There will be no growth in the average household income
- A 50/50 investment portfolio of stocks/bonds that averages an ROI of 8.6% (Vanguard)
- Any savings from reduced expenses will be reinvested
Finally, we can derive a baseline savings rate using 20 years of data from the U.S. Bureau of Economic Analysis:
From 1999 – 2019, the average savings rate was 6.1%.
Any savings from our reduced expenses will be added to this baseline savings rate.
This results in the following model:
Here is what stood out to me:
- The portfolio with the 20% reduction in the big 3 expenses was 248% larger then the portfolio that didn’t cut any expenses.
- The portfolio with the 20% reduction in the 3 discretionary expenses was 122% larger then the portfolio that didn’t cut any expenses.
- The portfolio with the 5% reduction in the big 3 expenses was 131% larger then the portfolio that didn’t cut any expenses.
- The portfolio with the 5% reduction in the big 3 expenses outperformed the portfolio with the 20% reduction in the discretionary expenses by 9%!
Final Thoughts
When it comes to financial independence, not all expenses are created equally.
Reducing our discretionary spending can get us financial independence sooner. However, we can maximize our results by instead shifting our focus to reducing the big 3 expenses.
Mark Cuban says it best:
60% of a watermelon is a whole lot more than 100% of a grape.
Mark Cuban
What kind of expenses have you reduced on your path to financial independence? Have you made any big changes to your big 3 expenses?!
Thank you for reading! 🙂
_
Full Disclosure: Nothing on this site should ever be considered to be advice, research or an invitation to buy or sell any securities, please see my Terms & Conditions page for a full disclaimer.