Welcome to the second financial update of 2021.
The purpose of these quarterly financial updates is to crunch the numbers, visualize the data and share our progress towards becoming financially independent.
Let’s see what happened during the second quarter of 2021 🙂
Life Update
For those new to Time Value Millionaire – Mrs. TVM and I purchased our first home last year. If you are a first time home buyer, I documented what we did step by step on our path to home ownership 🙂
My first project was taking advantage of the spring season and laying the foundation for our food forest!
I ended up planting 23 different fruit trees and bushes and building 6 raised beds for even more fruits, vegetables, and spices.
Fast forward one year later and we are enjoying the fruits of our labor (literally).
To date, we have enjoyed fresh:
- Lemons
- Strawberries
- Bananas
- Mangoes
- Watermelons
- Mint (tea)
- Broccoli
- Cayenne, Chili, Bell & Jalapeno Peppers
- Eggplant
- Lettuce
- Cauliflower
- Coffee (coming really soon)
Financial Update
Time to talk money.
A couple notes:
- The data visualizations are interactive; hover over sections of the graphs for more detailed information.
- Nothing on this site should ever be considered advice, research or an invitation to buy or sell securities, please see my ‘Terms & Conditions’ page for a full disclaimer.
Progress to Financial Independence
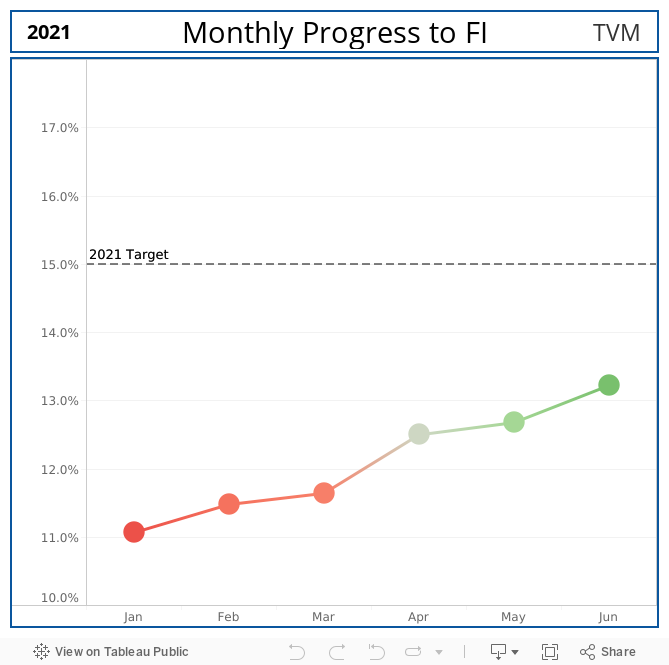
Our total % FI increased from 11.6% in Q1 2021 to 13.2% in Q2 2021.
This translates to a total % FI increase of 2.1% in 2021.
We are now ahead of schedule with meeting our 15% FI goal by the end of 2021!
Asset Breakdown
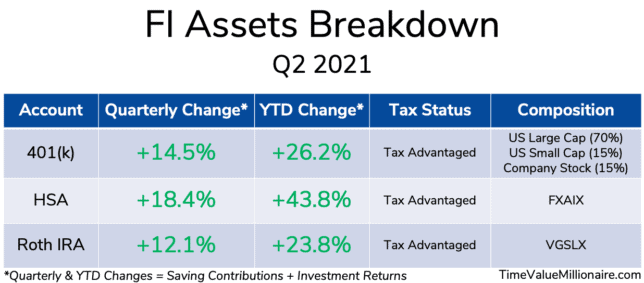
The above table is a breakdown of our current FI Assets.
We are extremely happy with the continued double digit growth of these accounts.
This growth can be attributed to a couple factors:
- The Market Gods
- Increased Savings Rate (see below)
Savings Rate
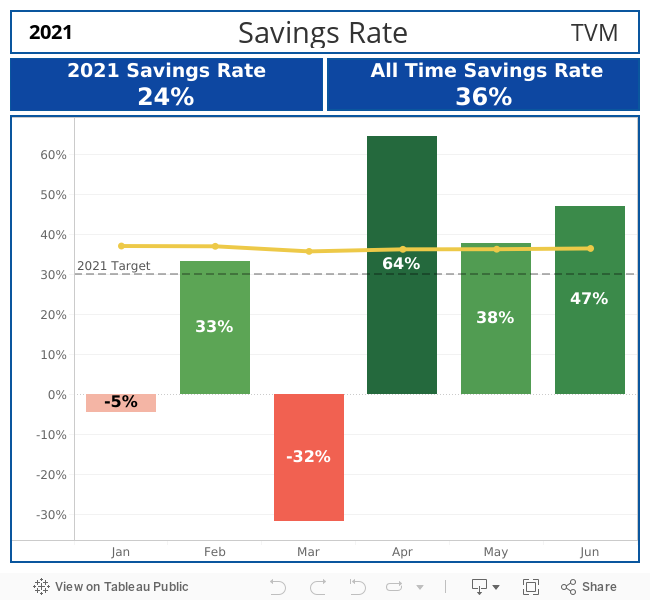
Our 2021 savings rate is currently at 24%.
Considering that our 2021 savings rate at the end of Q1 2021 was -1% (not a typo), we are happy to see the 25% increase at the end of Q2 2021!
This increase can be explained by two events that occurred at the end of Q1 2021:
- Becoming free of consumer debt (substantially decreasing one of our big 3 expenses)
- Internally negotiating a 25% raise
With our cars paid off, we anticipate our 2021 savings rate to continue to increase.
Monthly Expenses
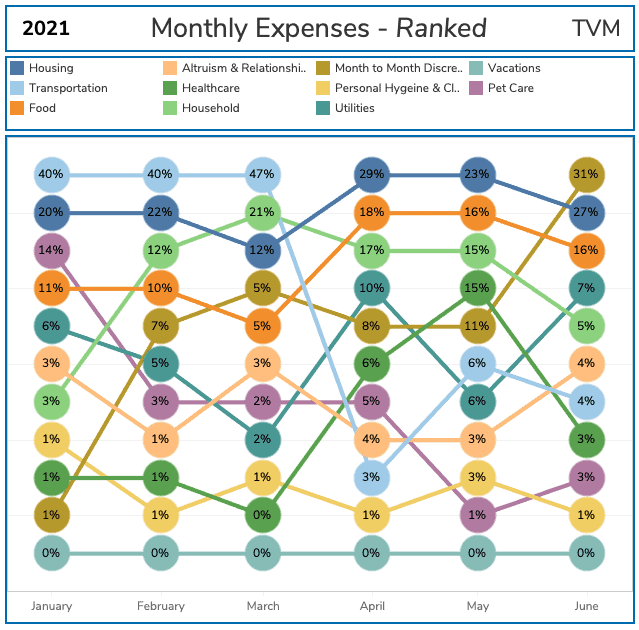
Let’s take a look at our Expense Sankey, aka Mrs. TVM’s favorite data visualization.
The above graphic visualizes how our monthly expenses rank month over month. The percentages in the individual bubbles represent what percentage of our income was spent on that category for that month.
Here is what stood out to me:
- Paying our cars off resulted in the transportation category not being one of our big 3 expenses any more 😀
- Our month to month category (fun money) temporarily became a big 3 expense… I may have spoiled Mrs. TVM with a new ring… just because 🙂
- We need a vacation!
Home Value vs. Mortgage Balance
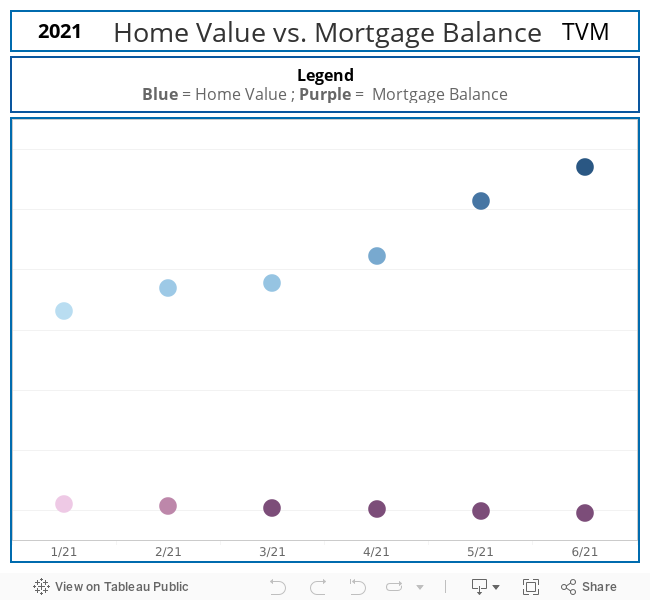
I originally created the above visualization to show our progress towards paying down our debt.
However, because we no longer have car loans and are not aggressively paying down our mortgage, I thought a visualization only showing a mortgage pay down would be boring.
Therefore, I repurposed this visualization to show our mortgage value relative to our home’s value to visualize our home equity.
Seeing this makes us feel better when we spend money on the house… got to protect that investment!
Final Thoughts
No matter what type of financial independence you are pursuing, it is always nice to crunch the numbers and see how things are coming along.
For Mrs. TVM and I, we are blessed that we have been able to get back on track in meeting our yearly 15% FI Goal.
How has your journey to financial independence been going this year? Have you hit any major financial goals this year?
Thank you for reading! 🙂
_
Full Disclosure: Nothing on this site should ever be considered advice, research or an invitation to buy or sell securities, please see my ‘Terms & Conditions’ page for a full disclaimer.