
One of the easiest ways to invest is by using the 3 Fund Portfolio method.
In essence, this means building an investment portfolio with only three funds that cover three broad asset classes:
- U.S. Stocks
- U.S. Bonds
- International Stocks
And while most of us have exposure to the first two asset classes, academic research suggests that investing in international stocks has the ability to decrease our overall risk exposure.
Fortunately, Vanguard offers two comprehensive international mutual funds that can help us with that:
- Vanguard Total International Stock Index Fund (VTIAX)
- Vanguard FTSE All-World ex-US Index Fund (VFWAX)
However, what are the differences between VFWAX vs. VTIAX?
Let’s dive in.
VFWAX vs. VTIAX: An Overview
Here is a high-level summary detailing both funds:
| VFWAX | VTIAX | |
| Fund Type | Mutual Fund | Mutual Fund |
| Asset Class | International/Global Stock | International/Global Stock |
| Category | Foreign Large Blend | Foreign Large Blend |
| Expense Ratio | 0.11% | 0.11% |
| Minimum Investment Required | $3,000 | $3,000 |
| Number of Stocks | 3599 | 7717 |
| Fund Total Net Assets | $53.1 billion | $402.9 billion |
| % of Fund in 10 Largest Holdings | 11.1% | 9.8% |
From the above table, we can immediately see that VFWAX and VTIAX are identical in Fund Type, Asset Class, Category, Expense Ratio and Minimum Investment.
What’s more interesting are the differences:
- VTIAX has 2.1X more Stocks than VFWAX
- VTIAX has 7.6X more Total Net Assets than VFWAX
- VFWAX’s 10 Largest Holdings account for 1.3% more than VTIAX’s 10 Largest Holdings
Let’s now explore these differences in more detail.
VFWAX vs. VTIAX: Differences in Portfolio Composition
The first difference is that VFWAX and VTIAX have slightly different portfolio compositions:
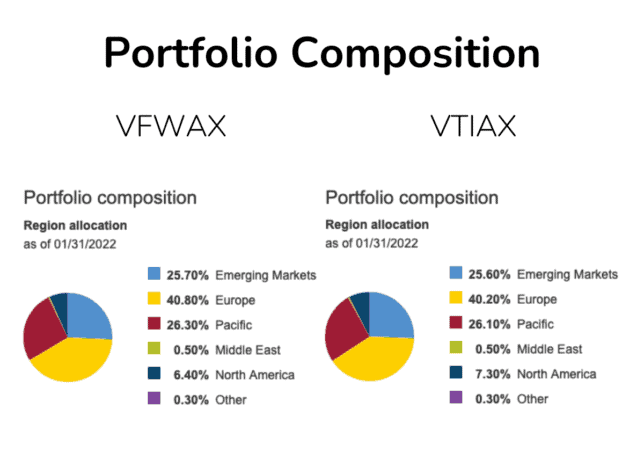
More specifically, here is a quick summary of the differences:
- VFWAX has a 0.1% greater position in Emerging Markets vs. VTIAX
- VFWAX has a 0.6% greater position in Europe vs. VTIAX
- VFWAX has a 0.2% greater position in the Pacific vs. VTIAX
- VFWAX has a 0.9% smaller position in North America vs. VTIAX
Overall, there is only a 1.8% variance in the region allocations making up each mutual fund.
VFWAX vs. VTIAX: Differences in Holdings
As of this writing, here are the 10 Top Holdings for VFWAX vs. VTIAX:
| VFWAX | VTIAX | |
| 1 | Taiwan Semiconductor Manufacturing Co. Ltd. | Taiwan Semiconductor Manufacturing Co. Ltd. |
| 2 | Tencent Holdings Ltd. | Tencent Holdings Ltd. |
| 3 | Nestle SA | Nestle SA |
| 4 | Samsung Electronics Co. Ltd. | Samsung Electronics Co. Ltd. |
| 5 | Roche Holding AG | Roche Holding AG |
| 6 | ASML Holding NV | ASML Holding NV |
| 7 | Toyota Motor Corp. | Toyota Motor Corp. |
| 8 | Alibaba Group Holding Ltd. | Alibaba Group Holding Ltd. |
| 9 | LVMH Moet Hennessy Louis Vuitton SE | LVMH Moet Hennessy Louis Vuitton SE |
| 10 | Shell plc | Shell plc |
As you can see, the Top 10 holdings for each fund are identical.
However, when we move beyond the Top 10 holdings, we begin to see noticeable differences between these funds.
Remember from earlier that:
- VTIAX has 2.1X more Stocks than VFWAX
- VTIAX has 7.6X more Total Net Assets than VFWAX
When we pull on this thread some more, we will find that VTIAX has more exposure to small cap companies with the median company size in it’s portfolio being $34.0 billion.
Furthermore, VFWAX has more exposure to large cap companies with the median company size in it’s portfolio being $41.5 billion.
It’s important to note that because VTIAX has greater exposure to small cap companies, it also has a higher turnover rate of 7.8% vs. the 4.7% turnover rate of VFWAX.
This generally translates to VFWAX being considered more cost-efficient.
VFWAX vs. VTIAX: Differences in Performance & Dividends
Despite VTIAX having 2.1X more stocks than VFWAX, the performance for both funds are nearly identical:

Over a 10 year time period, VTIAX ‘outperforms’ VFWAX by 0.02%.
Furthermore, here is a look at their dividend distributions:
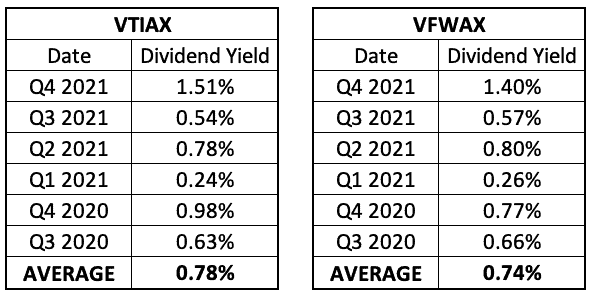
We can see that VTIAX is again ‘outperforming’ VFWAX by 0.04%.
Final Thoughts
What blows my mind is that despite VTIAX having 2.1X more stocks & 7.6X more total net assets than VFWAX, both funds have almost identical performance.
With that being said, if you were considering adding either fund to your investment portfolio, it really boils down to whether you are looking for exposure to small or large cap companies.
VTIAX’s small cap exposure means having a higher turnover rate (less cost efficient) but greater likelihood of having some of the small cap companies breaking out and being true winners.
VFWAX’s large cap exposure means a lower turnover rate (more cost efficient) and also having more stability in returns due to most companies already being quite established.
At the end of the day, VFWAX and VTIAX are nearly identical mutual funds and either would be a great way to gain international stock exposure.
Thank you for reading! 🙂
_
Full Disclosure: Nothing on this site should ever be considered advice, research or an invitation to buy or sell securities, please see my ‘Terms & Conditions’ page for a full disclaimer.